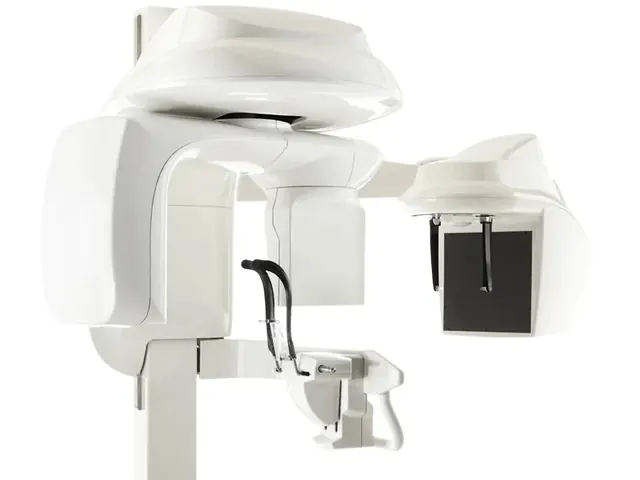
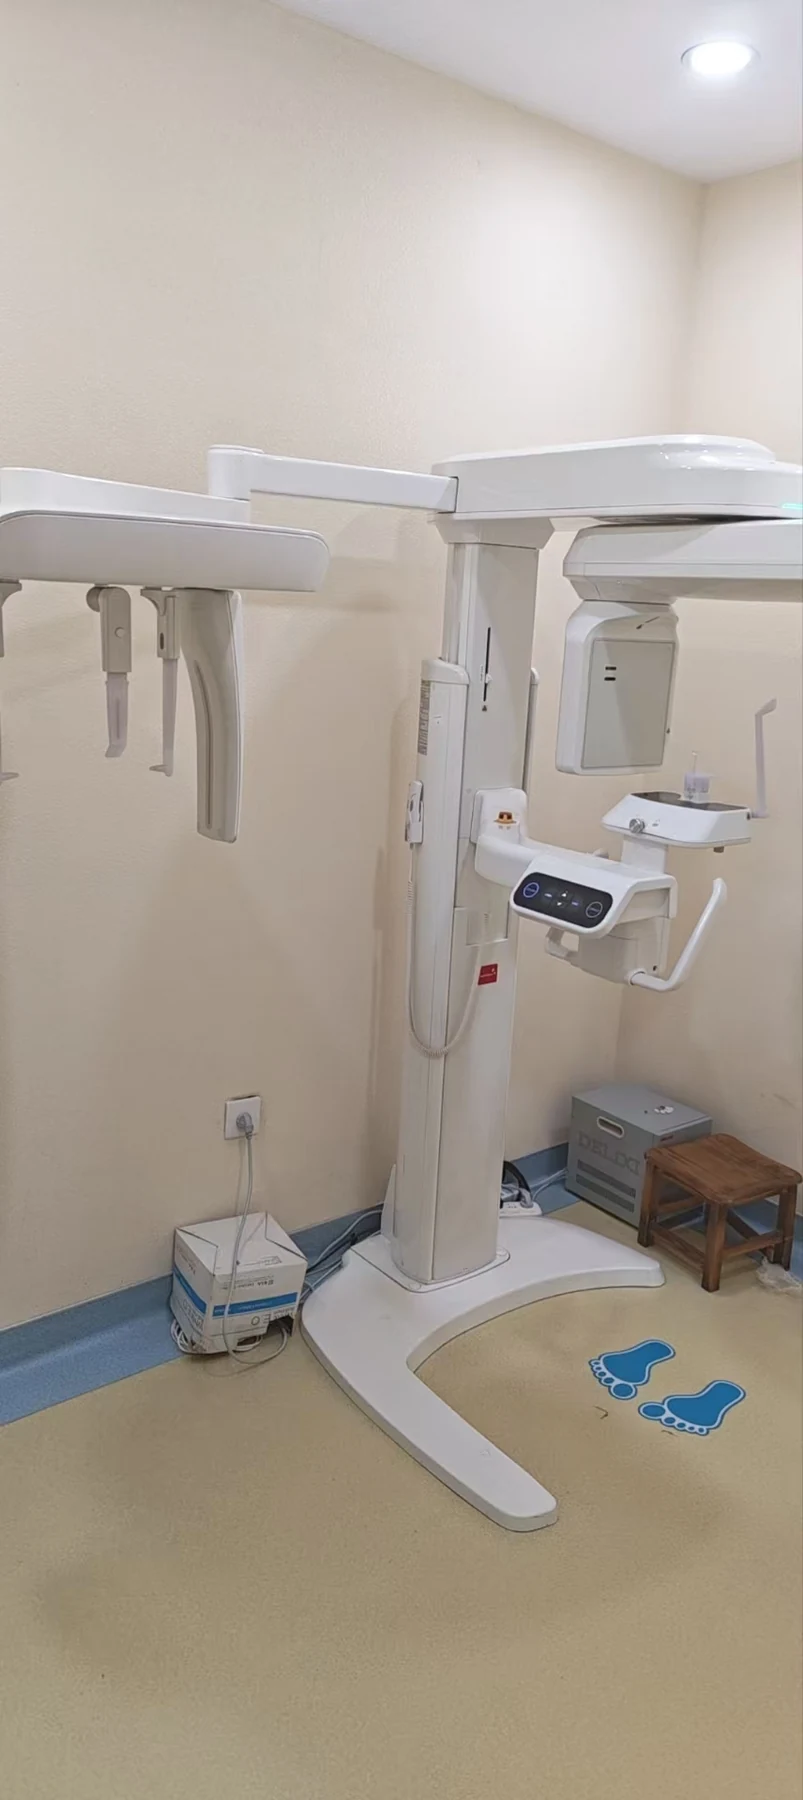
The decision to invest in in-house CBCT capability versus continuing to refer patients to external imaging centers is one of the most consequential equipment investment decisions in general and specialty dental practice. CBCT capital cost (USD 30,000–80,000 landed) and annual operational cost (space, shielding, physicist support, software maintenance) create real financial commitment. The question isn’t whether CBCT is clinically valuable — it is — but whether in-house CBCT is economically justified relative to external referral given your specific case mix, patient volume, and market position. This guide walks through the economic framework for that decision.
Three procurement models
Model 1: Full external referral
- All CBCT imaging referred to external imaging center, hospital, or specialty practice with CBCT
- Patient travels to external facility for imaging, returns with DICOM for clinical review
- Zero CBCT capital investment
- Typical external imaging fee: USD 150–400 per scan depending on destination market
- Referral workflow: 3–14 day turnaround typical
Model 2: In-house CBCT
- CBCT installed within practice facility
- Imaging captured in-visit or at dedicated imaging appointment
- Capital investment USD 30,000–80,000 landed
- Ongoing operational cost USD 4,000–15,000 per year (shielding compliance, software, service)
- Immediate imaging availability
Model 3: Shared CBCT (multi-practice cooperation)
- CBCT installed at shared location serving multiple referring practices
- Joint investment or lease arrangement among cooperating practices
- Lower per-practice capital commitment
- Requires administrative cooperation and scheduling coordination
- Emerging model in some markets
The breakeven calculation framework
Basic economics
- In-house CBCT cost per scan (fully loaded):
- Capital amortization: USD 80,000 / 10 years / 300 scans/year = USD 27/scan
- Operating cost: USD 10,000 / 300 scans/year = USD 33/scan
- Total cost per scan in-house: approximately USD 60/scan at 300 scans/year
- External referral cost per scan (practice perspective):
- Patient fee for external imaging: USD 150–400 paid by patient
- Administrative cost of referral coordination: USD 15–35 per case (staff time)
- Revenue opportunity cost: referred patient may not return, or treatment plan delayed reducing conversion
- Revenue generation from in-house CBCT:
- Scan fee collected: USD 120–350 per scan (varies by market and insurance)
- Treatment plan conversion improvement: 15–30% higher case acceptance with same-day imaging
- Referral capture: retained patients that would otherwise be lost to referring specialists
Basic breakeven analysis
- Annual capital + operating cost: USD 10,000 + USD 8,000 = USD 18,000 (mid-range estimate)
- Revenue per scan (net): USD 150 per scan after consumables and processing time
- Breakeven scan volume: 18,000 / 150 = 120 scans per year, approximately 10 scans per month
- Typical general practice CBCT-indicated volume: 4–15 scans per month
- Conclusion: breakeven achievable at mainstream implant-focused general practice; below breakeven at low-volume general practice
Beyond simple breakeven: strategic considerations
Revenue capture analysis
In-house CBCT captures revenue that would otherwise flow to external imaging centers or specialist practices:
- External imaging fee: patient typically pays imaging center USD 150–400 that doesn’t flow to primary practice
- Specialist referral retention: patients referred for CBCT may be retained by specialist practice providing imaging, losing primary practice’s follow-up revenue
- Treatment planning efficiency: same-day CBCT + planning + treatment discussion improves case conversion vs. multi-visit external imaging workflow
- Comprehensive fee capture: implant + CBCT + planning + surgical + prosthetic all stay in primary practice workflow
Case acceptance improvement
- Visual impact: patient seeing their own CBCT during treatment plan discussion substantially improves acceptance for complex cases
- Clinical confidence communication: 3D planning documentation communicates clinical thoroughness
- Same-day workflow: patient doesn’t have time to reconsider or research alternatives during multi-week referral delay
- Quantitative estimate: 15–30% case acceptance improvement for complex implant and full-mouth rehabilitation plans with in-house CBCT integration
Clinical quality and outcomes
- Better clinical decisions: CBCT in primary practice means easier CBCT utilization for all appropriate cases, not just those patients cooperate with external imaging
- Surgical safety: CBCT availability makes CBCT-guided implant surgery routine rather than occasional
- Endodontic success: small-FOV CBCT for complex endodontic cases improves diagnosis and treatment success
- Medico-legal protection: CBCT documentation supports clinical decision-making for any future disputes
Practice positioning and marketing
- Differentiation: in-house CBCT differentiates practice from lower-equipped competitors
- Specialist referral pattern: practices with CBCT attract referrals for complex cases from practices without imaging
- Patient attraction: patients seeking comprehensive digital practice prefer in-house imaging
- Competitive pressure: in some markets, CBCT is becoming standard expectation; absence creates competitive disadvantage
Volume thresholds by practice type
General practice with implant focus
- Implant case volume threshold: approximately 10–20 implant cases per month supports in-house CBCT
- Total CBCT volume (implant + endo + other): 10–25 scans per month typical at this level
- Economic viability: typically viable at this volume
Endodontic specialty practice
- Endodontic case volume threshold: approximately 80–200 endodontic cases per month
- CBCT indication rate: typically 20–40% of endodontic cases warrant CBCT
- Typical monthly CBCT volume: 20–80 scans
- Economic viability: strongly viable at mainstream endodontic specialty volume
Orthodontic practice
- New orthodontic case volume threshold: approximately 40–80 new starts per month
- CBCT indication rate: typically 15–25% of new orthodontic cases
- Typical monthly CBCT volume: 8–20 scans
- Economic viability: borderline at lower volumes; clearly viable at higher volumes and surgical orthodontic focus
Oral surgery practice
- Surgical case volume: implant surgery, third molar, pathology surgery
- CBCT indication rate: 30–60% of surgical cases
- Typical monthly volume: 30–80 scans
- Economic viability: strongly viable
Periodontal practice
- Periodontal surgical case volume: variable; implant practice extension
- CBCT indication rate: 15–35%
- Typical monthly volume: 8–25 scans
- Economic viability: borderline to viable depending on implant surgical volume integration
General practice without specialty focus
- CBCT indication rate: limited to occasional implant, endodontic, pathology cases
- Typical monthly volume: 2–8 scans
- Economic viability: typically below viable threshold; external referral remains appropriate
Referral market considerations
- Referral availability: some markets have well-established external CBCT imaging centers at reasonable cost; others lack such options
- Referral cost to patient: varies widely; some markets external CBCT is affordable, others expensive
- Insurance coverage: insurance reimbursement for external vs. in-house CBCT may differ
- Referral pattern lock-in: established referral relationships with specialists may create pressure either way
5-year total cost of ownership comparison
Example for a mid-volume implant practice at 15 CBCT cases per month:
External referral model (5-year)
- 15 cases/month × 60 months = 900 cases
- Patient pays external imaging center: USD 250 average × 900 = USD 225,000 (patient expense)
- Practice revenue impact: minimal direct (no imaging fee capture); indirect through reduced case acceptance
- Administrative burden: approximately 50 hours/year staff time for referral coordination = USD 10,000/year opportunity cost = USD 50,000 over 5 years
- Practice 5-year cost of external model: USD 50,000 + opportunity cost of reduced case acceptance
In-house CBCT model (5-year)
- Mid-tier CBCT landed cost: USD 55,000
- Shielding and installation: USD 10,000
- Operating cost over 5 years: USD 50,000 (shielding compliance, software, service)
- Total investment: USD 115,000
- Revenue from scans (at USD 250 patient fee × 900 cases): USD 225,000
- Incremental case acceptance value: 20% improvement in conversion on complex cases = approximately USD 150,000–400,000 depending on case mix
- Practice 5-year net benefit of in-house: USD 260,000–510,000
Conclusion for this example
At 15 CBCT cases per month (mid-volume implant practice), in-house CBCT delivers substantial 5-year financial benefit vs. external referral. The analysis favors in-house CBCT strongly at this volume level.
When external referral remains the better choice
- Low case volume: <3 CBCT-indicated cases per month
- Space constraints: cannot dedicate room to CBCT in current facility
- Capital constraints: USD 80,000+ investment is not financeable or prudent
- Regulatory complexity: destination country CBCT regulatory framework is complex relative to benefit
- Short-term practice horizon: planning sale, retirement, or closure within 3–5 years
- Excellent external referral options: adjacent imaging center provides reliable, affordable, patient-convenient CBCT
Phased approach: hybrid transition
Some practices benefit from phased approach:
- Phase 1: external referral only; track CBCT volume and clinical value over 12–24 months
- Phase 2: if volume growth justifies, commission in-house CBCT
- Phase 3: expand CBCT utilization across specialties, integrate with comprehensive digital workflow
This phased approach reduces early-commitment risk while maintaining option to invest when justified.
Financing considerations
- Lease-to-own: financing option spreading capital cost over 3–7 years
- Vendor financing: some CBCT manufacturers offer in-house financing; compare to third-party rates
- Bank equipment loan: conventional bank financing at destination country rates
- Operating lease: equipment rental model with no ownership; lower capital commitment, higher total cost over time
- Typical financing rates: 6–12% APR for medical equipment financing in most destination markets
Decision framework summary
Strong case for in-house CBCT
- Monthly CBCT-indicated case volume >10
- Implant, endodontic, or orthodontic specialty focus
- Long-term practice horizon (5+ years)
- Adequate space and capital
- Competitive market where CBCT creates differentiation
Strong case for external referral
- Monthly volume <3 cases
- General practice without specialty focus
- Short-term practice horizon
- Space or capital constraints
- Excellent external referral options available
Borderline: hybrid or phased approach
- Monthly volume 3–10 cases
- Growing practice trajectory
- Considering specialty expansion (implant, endodontic)
- Interest in comprehensive digital workflow but uncertain about commitment
Evaluating in-house CBCT vs. external referral for your practice?
WhatsApp us with your practice context (general, specialty focus), monthly CBCT-indicated case estimate, destination country and local external referral market, practice horizon, and capital availability. We’ll work through the economic framework for your specific context, model 5-year total cost of ownership for in-house vs. external, propose CBCT options matched to your actual volume needs, and quote FOB Shanghai pricing with full landed cost and financing analysis if in-house model is justified.
Ready to price this out?
Tell us the model, quantity and destination port. We reply with FOB or CIF pricing, current stock status and a video demo where the unit is in our Shanghai warehouse.